

Each year we publish a variety of reports concerning both our financial performance and our performance in other facets of our business. We publish our SEC filing, annual report and information statement on our website for the public. View and download reports and information here.
By the Numbers
Review our sales figures, price of service, employee statistics, and customer segments.
Kilowatt-Hour Sales
The company's total sales, including off-system sales, were 98.8 billion kilowatt-hours during 2025. Georgia Power's 2025 territorial sales were 89.3 billion kilowatt-hours.
Price of Service
The average price residential customers paid during 2025 was 16.29 cents per kilowatt-hour, and the average annual use per residential customer was 11,878 kilowatt hours.
Employees & Retirees Receiving Benefits
Georgia Power had 7,760 employees. A combined 9,496 retirees, survivors and vested former employees were receiving benefits.
Customer Segments
Customers
2,833,530 total Georgia Power customers
Residential
2,480,484
Commercial
332,970
Industrial
10,512
Public Streets & Highways
9,564
Total 9,564 includes 1 Rapid Transit Authority
Customers by Region
Customers by Region
Regions: Excluding wholesale customers.
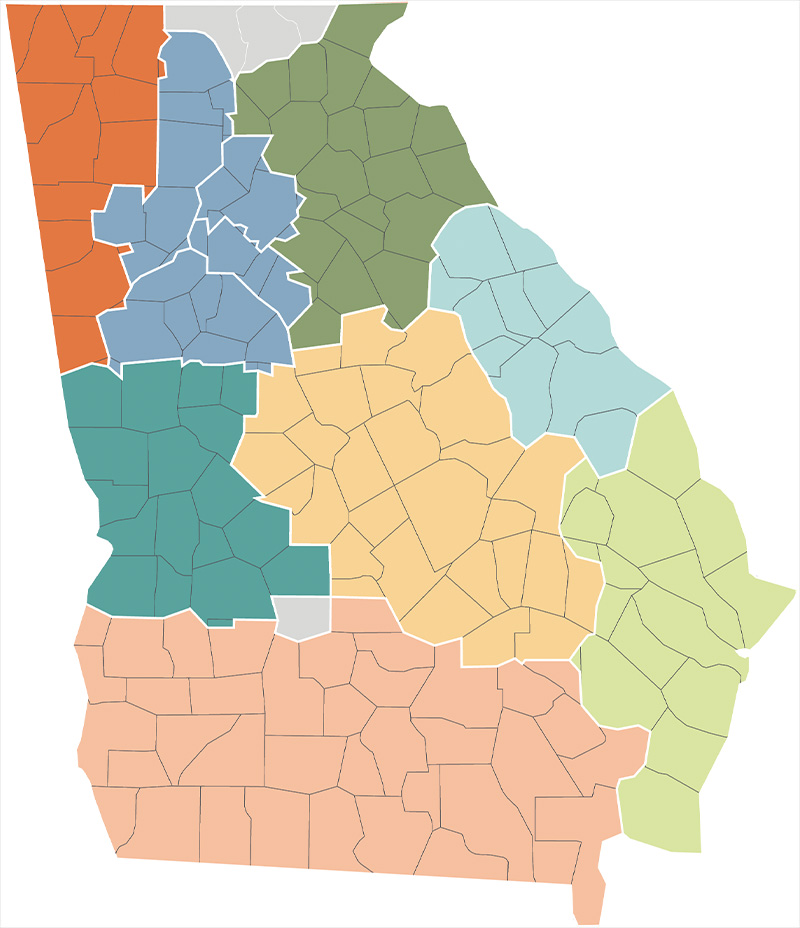
Service Territory
Georgia Power provides electric service to customers in 155 of the state's 159 counties.
- Central 176,831
- Coastal 347,951
- East 181,801
- Metro Atlanta 1,442,624
- Northeast 212,679
- Northwest 185,176
- South 139,647
- West 146,821
2025 Community Investment
$33.7 million in charitable causes
1,000+ organizations supported
$1M
In employee giving
$3M
Value of 88,000 hours volunteered by our employees and retirees
$29.7M
Contributions from Georgia Power and Georgia Power Foundation, Inc.
Taxes
Georgia Power's 2025 tax payments to city, county, state and federal agencies totaled more than $1.6 billion, or about 13 percent of operating revenues. This represents approximately $549 per customer. Georgia Power is one of Georgia's largest taxpayers.
Investments
The total gross investment in facilities was $64.1 billion.
Where Revenues Come From
| Residential | 38.0% |
| Commercial | 34.4% |
| Industrial | 14.8% |
| Wholesale | 4.2% |
| Other | 8.6% |
Transmission & Distribution
| Overhead and underground distribution lines added | 678 miles |
| Total distribution lines | 80,865 miles |
| Total transmission lines (Georgia Power owned) | 10,770 miles |
Georgia Power Plants
A–K
| Name | kW Capacity | Fuel Source |
|---|---|---|
| Bartletts Ferry | 173,000 | Hydro |
| Bowen | 3,160,000 | Coal |
| Burton | 8,100 | Hydro |
| Comer | 2,160 | Solar |
| Dalton | 6,508 | Solar |
| Falcons Solar | 1,019 | Solar |
| Flint River | 5,400 | Hydro |
| Fort Benning | 30,005 | Solar |
| Fort Gordon | 30,000 | Solar |
| Fort Stewart | 30,000 | Solar |
| Fort Valley Solar | 10,800 | Solar |
| Guyton | 3,600 | Solar |
| Goat Rock | 40,500 | Hydro |
| Hatch | 899,612 | Nuclear |
| Kings Bay | 30,161 | Solar |
L–R
| Name | kW Capacity | Fuel Source |
|---|---|---|
| LaGrange | 800 | Solar |
| Lloyd Shoals | 18,000 | Hydro |
| MCLB* | 31,161 | Solar |
| McDonough, C.C. | 2,520,000 | Oil, Gas |
| McDonough-Unit 3 | 78,800 | Oil, Gas |
| McIntosh Ash Pond | 10,000 | Solar |
| McIntosh, C.C. | 1,318,920 | Oil, Gas |
| McIntosh, C.T. | 640,000 | Oil, Gas |
| McManus** | 481,700 | Oil |
| Moody AFB | 49,500 | Solar |
| Morgan Falls | 16,800 | Hydro |
| Mossy Branch | 65,000 | Battery |
| Nacoochee | 4,800 | Hydro |
| North Highlands | 29,600 | Hydro |
| Oliver Dam | 60,000 | Hydro |
| Robins | 158,400 | Oil, Gas |
S–Z
| Name | kW Capacity | Fuel Source |
|---|---|---|
| Robins AFB | 128,000 | Solar |
| Rocky Mountain | 229,272 | Hydro |
| Scherer | 750,924 | Coal |
| Sinclair Dam | 45,000 | Hydro |
| Tallulah Falls | 72,000 | Hydro |
| Terrora | 20,800 | Hydro |
| Tri-County EMC | 1,008 | Solar |
| Tugalo | 45,000 | Hydro |
| UGA | 984 | Solar |
| Vogtle | 2,167,094 | Nuclear |
| Wallace Dam | 321,300 | Hydro |
| Waynesboro | 2,400 | Solar |
| Wilson** | 354,100 | Oil |
| Yates | 700,000 | Gas |
| Yonah | 22,500 | Hydro |
C.C. – Combined cycle; C.T. – Combustion turbines
*Marine Corps Logistics Base Solar
** Includes internal combustion unit
Jointly Owned Plants
| Units | FP&L | OPC | MEAG | Dalton | Georgia Power | Total MW Capacity | |
|---|---|---|---|---|---|---|---|
| Hatch | 1&2 | — | 30.0% | 17.7% | 2.2% | 50.1% | 1,796 |
| Rocky Mtn. | 1–3 | — | 74.6% | — | — | 25.4% | 903 |
| Scherer* | 1&2 | — | 60.0% | 30.2% | 1.4% | 8.4% | 1,636 |
| Scherer* | 3 | 25.0% | — | — | — | 76.4% | 818 |
| Vogtle | 1-4 | — | 30.0% | 22.7% | 1.6% | 45.7% | 2,320 |
OPC - Oglethorpe Power Corporation; MEAG - Municipal Electric Authority of Georgia; Dalton - City of Dalton, Georgia
Generating Capacity
| Total Georgia Power Kw Capacity | |
|---|---|
| Gas/Oil | 6,251,920 |
| Coal | 3,910,924 |
| Nuclear | 3,066,706 |
| Hydro | 1,112,072 |
| Renewables | 368,106 |
| Battery | 65,000 |
| Total | 14,774,728 |
Fuel Cost for Generation
| Cents Per Kilowatt-Hour | |
|---|---|
| Nuclear | 0.89 |
| Coal | 4.31 |
| Oil and Gas | 3.53 |
| Average | 2.72 |
Generation Plant Locations
- Hydro
- Nuclear
- Steam
- Solar
- Combined Cycle
- Combustion Turbine
- Battery Energy Storage

Energy Mix
- 1% Hydro
- 6% Renewables
- 6% Null*
- 28% Nuclear
- 42% Gas / Oil
- 17% Coal
2025
* Georgia Power reports only the null energy output from some renewable generating facilities. Ownership of the associated renewable energy credits (RECs) is specified in each respective power purchase agreement or program tariff. The party that owns the RECs retains the right to use and report them.
2026 Facts and Figures Printable PDF
The 2026 Facts & Figures brochure is filled with pertinent information about Georgia Power, including customer numbers, plant generation capacities, kilowatt-hour sales, social media impressions and more.